This post is part of a series looking at the most important components of the analytics built into each social platform. We’ll also look at Facebook, Instagram and Video across platforms.
With more than 200 accounts across across campus, Twitter is probably the most ubiquitous of all social media platforms for sharing news and information. As there are more than 350,000 tweets sent every minute, being successful on the platform necessitates a steady content stream, and intentionality and strategy behind pairing text with images and video to catch someone's eye in the noise of their Twitter feed.
But how do you know if you're actually reaching your audience?
Twitter has a number of key metrics that can help you measure success on the platform built in at analytics.twitter.com. From here you can easily export the data for specific date ranges or view the data on the web - it's beneficial to take a look at least once a month to help inform your goals and strategy.
After logging into your account, you'll want to take a look at the following screens: Home and Tweets.
The Home page shows you a general overview of how your page has performed in the past 28 days and provides a quick +/- comparison to the previous 28 days. This is a great screen to get a quick idea of how you’ve done by seeing how many of these arrows are red and how many are green.
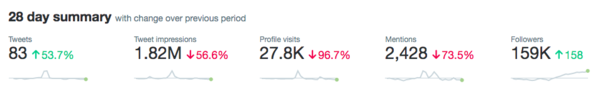
You shouldn't let the red and green percentages be the only definition of your success, however, as there are a number of reasons that you may have gotten more or less attention in a given month. For example, the screen shot above was taken on June 3, 2019. The previous 28 day period included the April 15 fire at Notre-Dame Cathedral in Paris and on that day and the one following the @NotreDame account had 2.7 million impressions as people searched for information about the fire and found the University account instead of the Cathedral. When taking that into consideration being down 56% on impressions for this 28 day period isn't very problematic.
Below the summary you can see a brief snapshot of each month showing the tweet with the most impressions, the top media tweet (which more often than not will be the tweet with the second highest impressions), your top follower and the tweet that reached the most people that mentioned your Twitter handle.
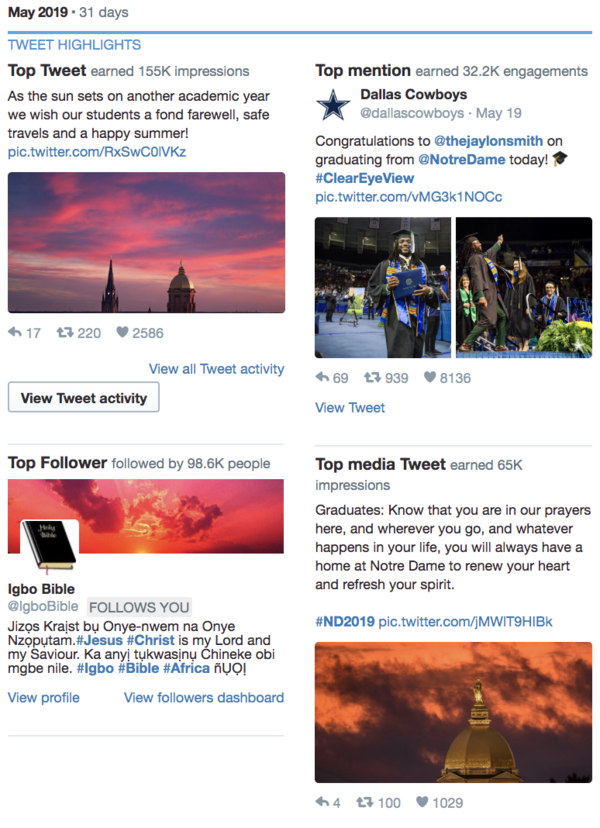
It also shows a snapshot of a few other metrics on the platform that can help you see how your account is performing month over month.
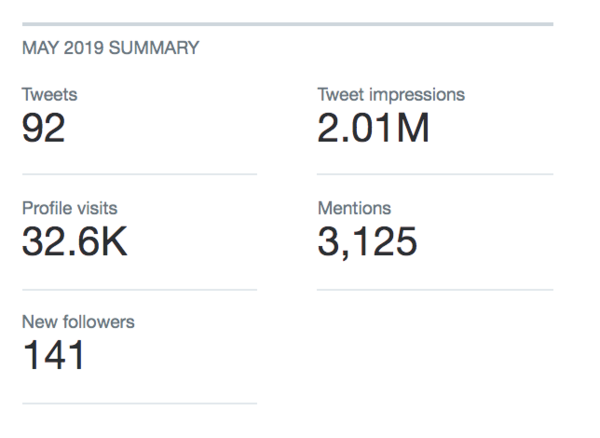
These three components can give you a great at-a-glance overview of your account, but diving deeper on the Tweet page will show you how all of your content is performing rather than just the top pieces.
Here you can define your timeframe and see every piece of content to examine it in a few different ways.
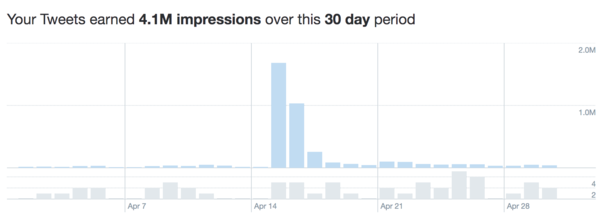
First, you'll see the overall impressions broken down by day:
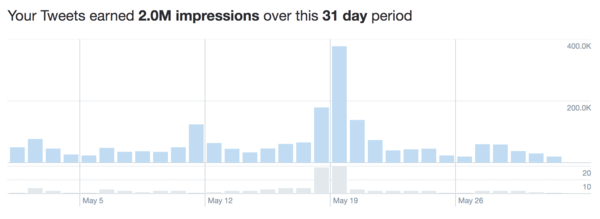
It's helpful to map each peak to whichever piece of content or event may have caused it. For example, the above spike on May 19 reflects Commencement, while the below spike on April 15 & 16 is the aforementioned Notre-Dame Cathedral fire.
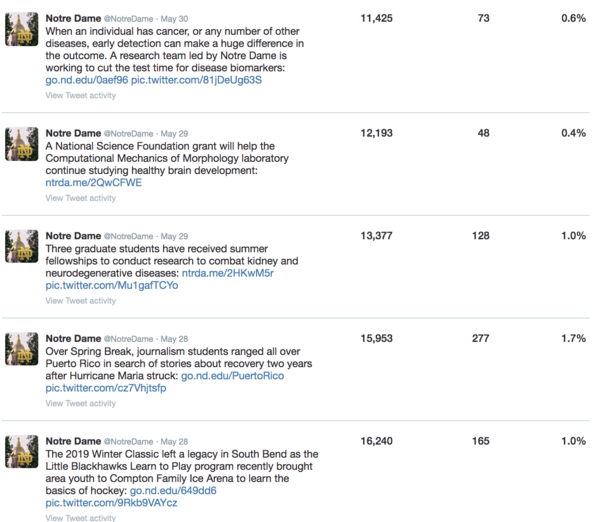
Scrolling farther down you can see how each tweet you sent performed. This can be especially helpful if you've shared tweets leading to the same news or information in different ways (either with new text or new photos or videos) as you can see which tweet performed best to better inform your content creation in the future.
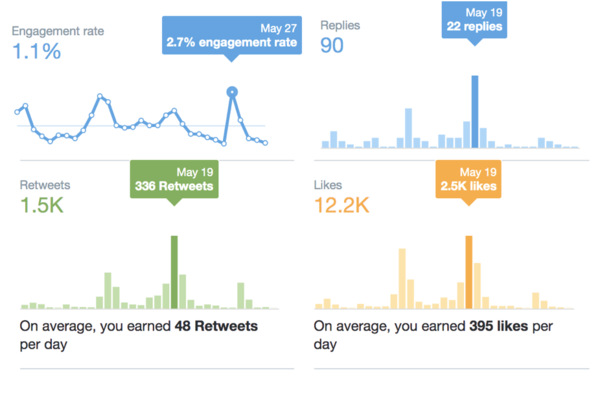
And finally, you'll see a column of boxes on the right hand side of the screen that show the engagement rate, link clicks, retweets and likes.
Reviewing all of these metrics regularly will help you understand what content performs best on Twitter and help inform decisions on how and what to post.
If you have questions about any of data from your Twitter Analytics, contact Liz Harter, Social Media Manager.
Next, we'll look at Instagram Statistics.