This post is part of a series looking at the most important components of the analytics built into each social platform. We’ll also look at Twitter, Instagram and Video across platforms.
In early 2018, Facebook changed its algorithm to focus more heavily on friends and family - the people you are connected to rather than the brands that you have liked on the platform. The move was introduced as “Bringing People Closer Together,” but was also frequently referred to as “Facebook Zero” as it was thought that organic, or non-paid reach, will hit zero percent. (This shouldn’t be confused with the actual Facebook Zero initiative which saw the social network partner with wireless carriers in developing countries to waive internet access fees to show a pared down, text-only version of the site.)
Organic reach prior to that point was sitting at about 6%, meaning 6 people would see your post for every 100 followers you had. If even less than 6% of your followers would see your posts, does it even make sense to take the time to post there? The answer, in short, is yes, if that is where the majority of your audience already is.
While analytics have always been important to make sure that we’re hitting the mark with our audience and messaging, it is imperative to look at the data now to make informed decisions about what types of content you should be posting to try to reach more than that 6%.
So what should you be looking at?
Using Facebook’s own Insights can be overwhelming but there are three screens you should definitely be looking at.
The first screen when you click “Insights” is a general overview of how your page has performed in the past week. This is a great screen to just get a quick idea of how you’ve done by seeing how many of these arrows are red and how many are green (hopefully more of them are green).
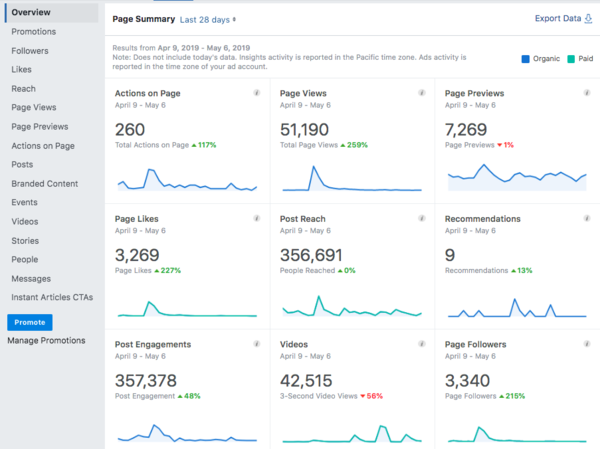
From here you can dig a little deeper to find more information.
Let’s click on posts next.
Here you can see, again, a couple of overviews.
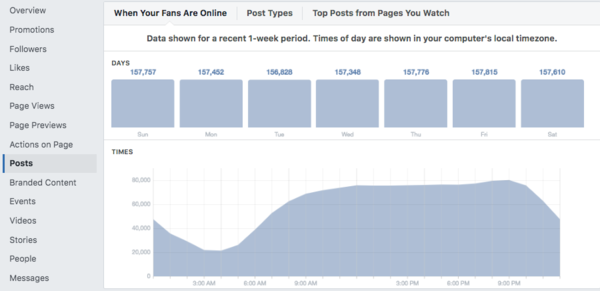
These first graphs tell you when your audience is online. They’re useful but this information is also pretty easy to guess if your audience is pretty localized to one country - there’s a dip in the overnight hours and a swell throughout the day until evening when most people check social media.
While more than 50% of Americans on Facebook use it daily, there can be a bit more variation in the days your audience is online especially if your page is more specialized.
Knowing this information can help you decide when you should be posting, especially if you don’t have enough content to post daily.
If you click the next tab over you can learn a bit of general information about what types of posts perform best on your page.
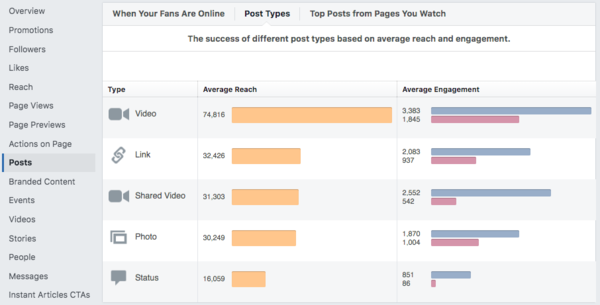
These should always be taken with a grain of salt as you can explain some of the outliers with ease. For example, it looks like the Notre Dame Facebook page would find the most success posting video if the average video reaches 100,000 people, but this number is skewed by the fact that most of our viral posts are videos and while that is true, it’s false to say most of our videos are viral posts.
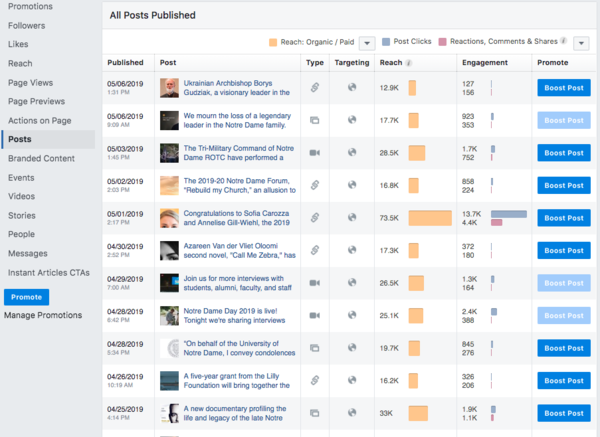
To understand the context behind this data, you have to scroll a little farther down on this page to see specific posts and their outcome.
Here I like to look at the reach, differentiating between organic and paid, and the engagements - the lower number is more important as it is the number of times people meaningfully interacted with the post by liking, commenting or sharing - aka an action that could put that post in the timeline of their friends - but the upper number of clicks is also interesting as it could be a click to “see more...”, open a photo to see it larger, play a video or read the comments.
Those are the three places to look for the most important Facebook analytics. There is one other place to look if you want to get a little more advanced and compare your page a little more to others.
The Pages to Watch section is on the “Overview” page at the bottom. You can “watch” any pages here to easily see how you’re doing in comparison to them so it’s best to follow similar pages at other institutions or other campus partners to get a baseline for how you’re doing.
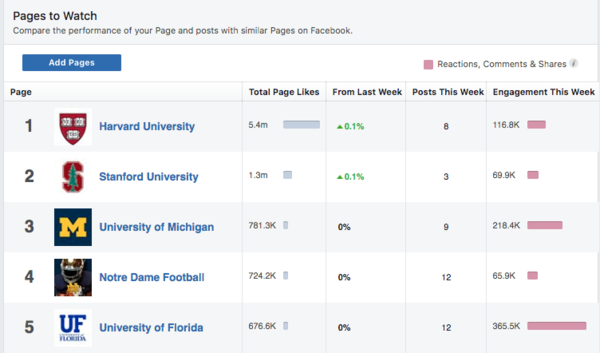
If you’re following accounts with wildly different follower numbers, though, you might feel inadequate when looking at how your page with a small amount of followers is doing in relation to say the University overall which benefits from that larger following.
To make this more of an apples to apples comparison you can figure out the engagements per post per follower.
For example, let’s look at the data for the Notre Dame Facebook page:

To find the engagements per post per follower, we’d take:
48,100 / 6 / 184,900
which equals 4%.
This number is low, but doing the math we can see it’s on the high side for those pages we’re watching, so it’s a good baseline to see if your content is performing well on the platform.
If you have questions about any of data from your Facebook Insights, contact Liz Harter, Social Media Manager.
Next, we’ll look at what metrics to look at in Twitter’s analytics.